What exactly is a sales data model?
Gathering, analyzing and interpreting data on sales performance is known as a sales data model. It entails looking at market trends, consumer interactions and sales data. Enhancing client involvement, maximizing revenue production, and improving sales tactics are the objectives.
Descriptive, diagnostic, predictive, and prescriptive analytics are among the several forms of sales analytics. The aim of descriptive analytics is a historical sales performance. Diagnostic analytics find the causes of patterns in performance. Predictive analytics help in predicting future sales and also offers suggestions that can be put into practice.
Contents:
- What exactly is a sales data model?
- Why sales data models are Important?
- Features of sales data model
- Industry-wise sales data model key metrics Table
- Conclusion
Why sales data models are Important?
Sales performance can be understood using sales data models. It aids in improving sales tactics, streamlining sales procedures and comprehending consumer behavior. Data-driven insights are beneficial for making business decisions. Businesses monitor market demand, customer retention and revenue growth. Sales performance and areas for improvement are clearly displayed to sales teams.
Pricing, plans customer segmentation, and sales forecasting are all supported by sales data models. It streamlines sales pipelines, improves efficiency, and spots sales patterns. Profitability and sales execution are enhanced by data-driven decision-making. Businesses better allocate their resources by coordinating their sales efforts with market demand.
Features of sales data model
Gathering and combining data: Data from CRM, ERP and other sales-related platforms is combined by using sales data models. It guarantees the correctness and consistency of the data.
Forecasting sales: Future sales patterns are predicted via predictive analytics. Businesses foresee changes in demand and modify their tactics appropriately.
Segmenting customers: Customers are categorized by using sales data models according to their demographics, past purchases, and behavior. Companies customize their sales and marketing plans.
Monitoring performance metrics: Businesses keep an eye on important sales metrics like revenue, conversion rates and sales cycle duration. Performance gaps are evaluated by sales teams.
Analysis of competition: Sales analytics assesses the market positioning and sales performance of rivals. Companies hone their sales tactics to stay ahead of the competition.
Optimization of pricing: To identify the best price models, businesses examine pricing methods. Maximizing income while preserving customer happiness is made possible by sales analytics.
Analysis of sales funnels: Bottlenecks in the sales funnel are found using sales analytics. Companies improve client acquisition efforts and optimize lead conversion procedures.
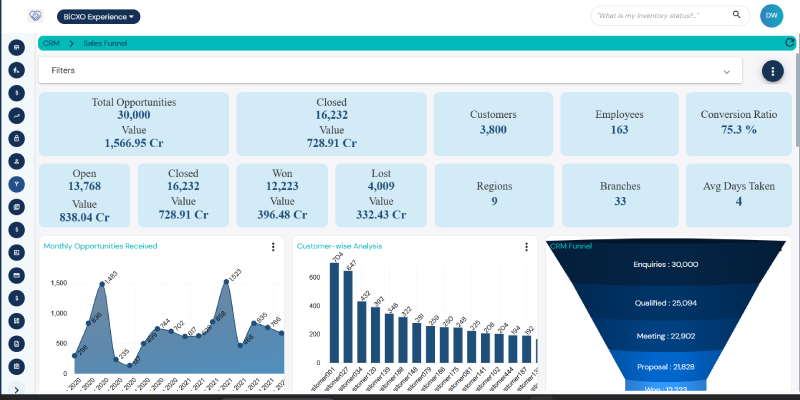
Real-time dashboards and reporting: Sales data is shown in real time on interactive dashboards. Decision-makers have access to the most recent data on sales performance.
Industry-wise sales data model key metrics
| Type of Industry | Key Metrics |
|---|---|
| Automotive Industry | Vehicle sales per dealer Average profit per vehicle sold Customer retention rate Warranty claim rate Service contract penetration Inventory turnover rate |
| E-commerce Industry | Website traffic to conversion ratio Cart abandonment rate Repeat purchase rate Customer acquisition cost (CAC) Lifetime value of a customer (CLV) Return on ad spend (ROAS) |
| Financial Services Industry | Loan approval rate Customer acquisition cost Net interest margin Customer retention rate Cross-sell and upsell ratio Revenue per advisor |
| Healthcare Industry | Patient acquisition cost Insurance claim approval rate Revenue per bed Treatment adherence rate New patient conversion rate Appointment no-show rate |
| Manufacturing Industry | Sales order fulfillment rate Lead conversion rate Days sales outstanding (DSO) Product return rate Production efficiency ratio Revenue per product line |
| Retail Industry | Sales per square foot Conversion rate Customer retention rate Average transaction value Inventory turnover rate, Gross margin return on investment (GMROI) |
| Software as a Service (SaaS) Industry | Monthly recurring revenue (MRR) Customer churn rate Customer lifetime value (CLV) Average revenue per user (ARPU) Net promoter score (NPS) Trial-to-paid conversion rate |
| Telecommunications Industry | Subscriber growth rate Customer churn rate Revenue per user Data usage per subscriber Service activation time Call drop rate |
Sales performance is continuously monitored thanks to sales data models, enabling businesses to track trends and make informed decisions in real time. Market positioning and corporate strategy are enhanced by data-driven insights, allowing companies to stay competitive and adapt to changing consumer demands. By leveraging advanced analytics, businesses can identify patterns, optimize pricing strategies, and allocate resources more effectively.
Additionally, predictive analytics help forecast sales patterns, identify potential risks, and uncover new market opportunities, ensuring long-term success. Businesses can improve customer experience by personalizing interactions and addressing the needs proactively. With data-driven decision-making, companies achieve sustainable growth, enhance operational efficiency, and maximize profitability.